Flowcharts - Overview
Flowcharts are a powerful feature that can be used with Home Layouts and Equipment Layouts for visually representing your event model and quickly launching into appropriate IndySoft events. Flowcharts are used in 2 locations:
Flowcharts in Home View
Use a flowchart embedded in a Home View layout to represent your event model and quickly launch into custom search-by dialogs, which can launch IndySoft events:
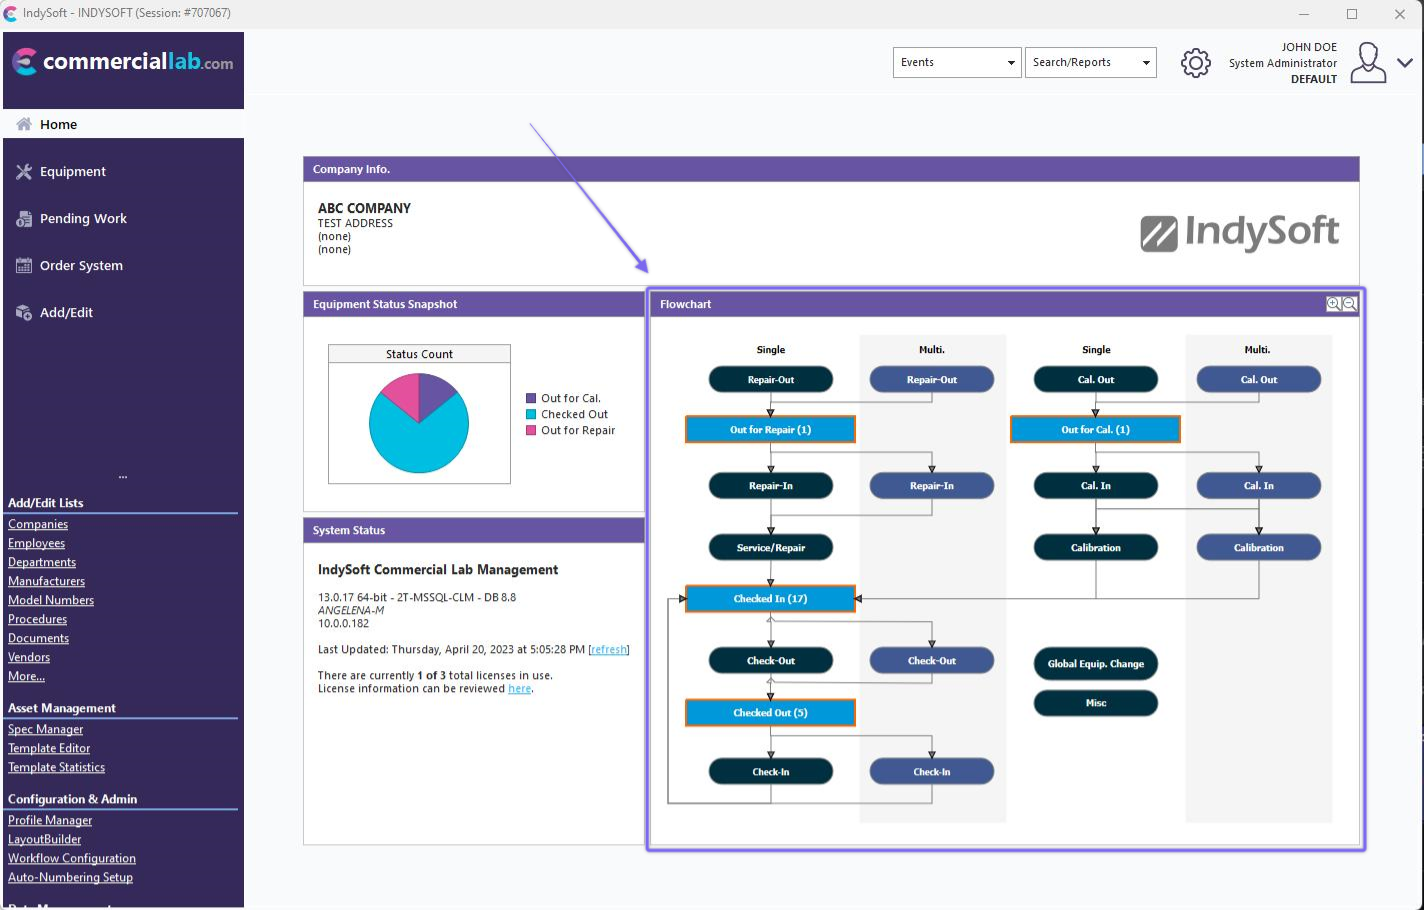
Example - Using Flowchart in Home View
When a flowchart is embedded in the Home View, the tracking status-related objects in the flowcharts are interactive (can be clicked), and the event-related boxes are simply for reference. When a user clicks on a tracking status object, they are launched into a custom search that shows all assets currently in this tracking status, plus an option filter setup for the entire flowchart. For example, your responsibility might be for all assets at the 'MAIN LAB' location. So your manager sets up your flowchart to always filter based on 'Current Location is (exactly) MAIN LAB.' All the custom search bys launched from the flowchart on your Home View will always assume this base filter.
Events are quickly launched from within custom search bys through the 'quick launch' buttons on the bottom left of the dialog:
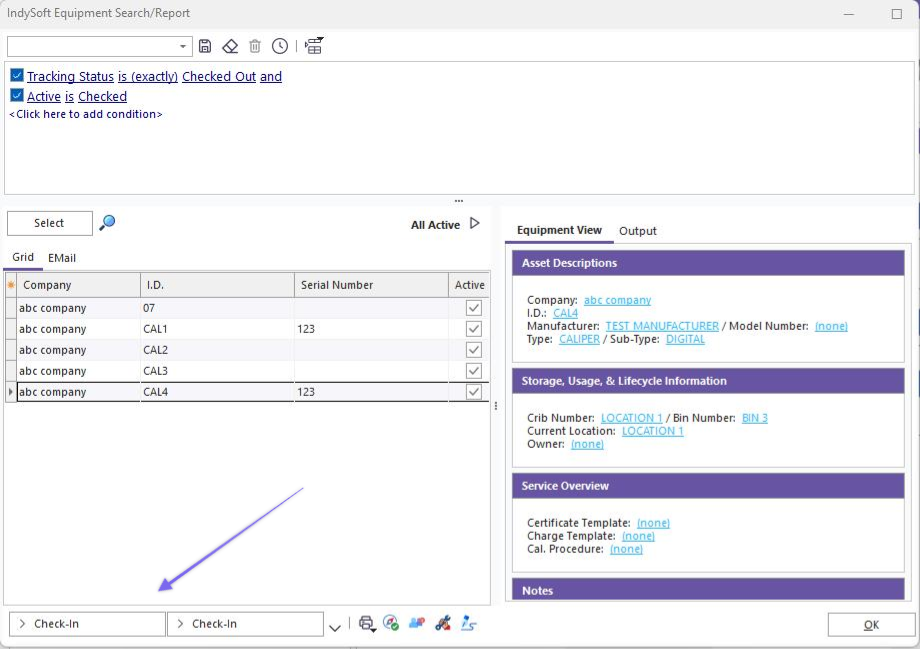
Quick Launch Event Buttons from Custom Search By
IndySoft automatically determines this number of quick launch buttons based on the arrows that connect the objects in your flowchart.
On the Home View flowchart, notice that all tracking status objects show a count of the number of assets that match this status in parenthesis (this is an option per flowchart). All objects that have a non-zero count are highlighted in a blue (or other custom color) border for easy review. These are the statuses that currently require your attention.
Each flowchart also has the option of showing a bar chart to the right of the flowchart. This bar chart duplicates the same data shown by the flowchart - but focuses only on tracking non-zero status objects displayed as a bar chart. The bar chart is also interactive - click on a bar to launch a custom search by showing all assets currently having this status. A click on a bar chart bar is equivalent to a click on a tracking status object in the flowchart.
Flowcharts are set up in LayoutBuilder through the Flowchart Editor. One flowchart can be used in multiple Home Layouts and/or Equipment layouts.
Flowcharts in Equipment View
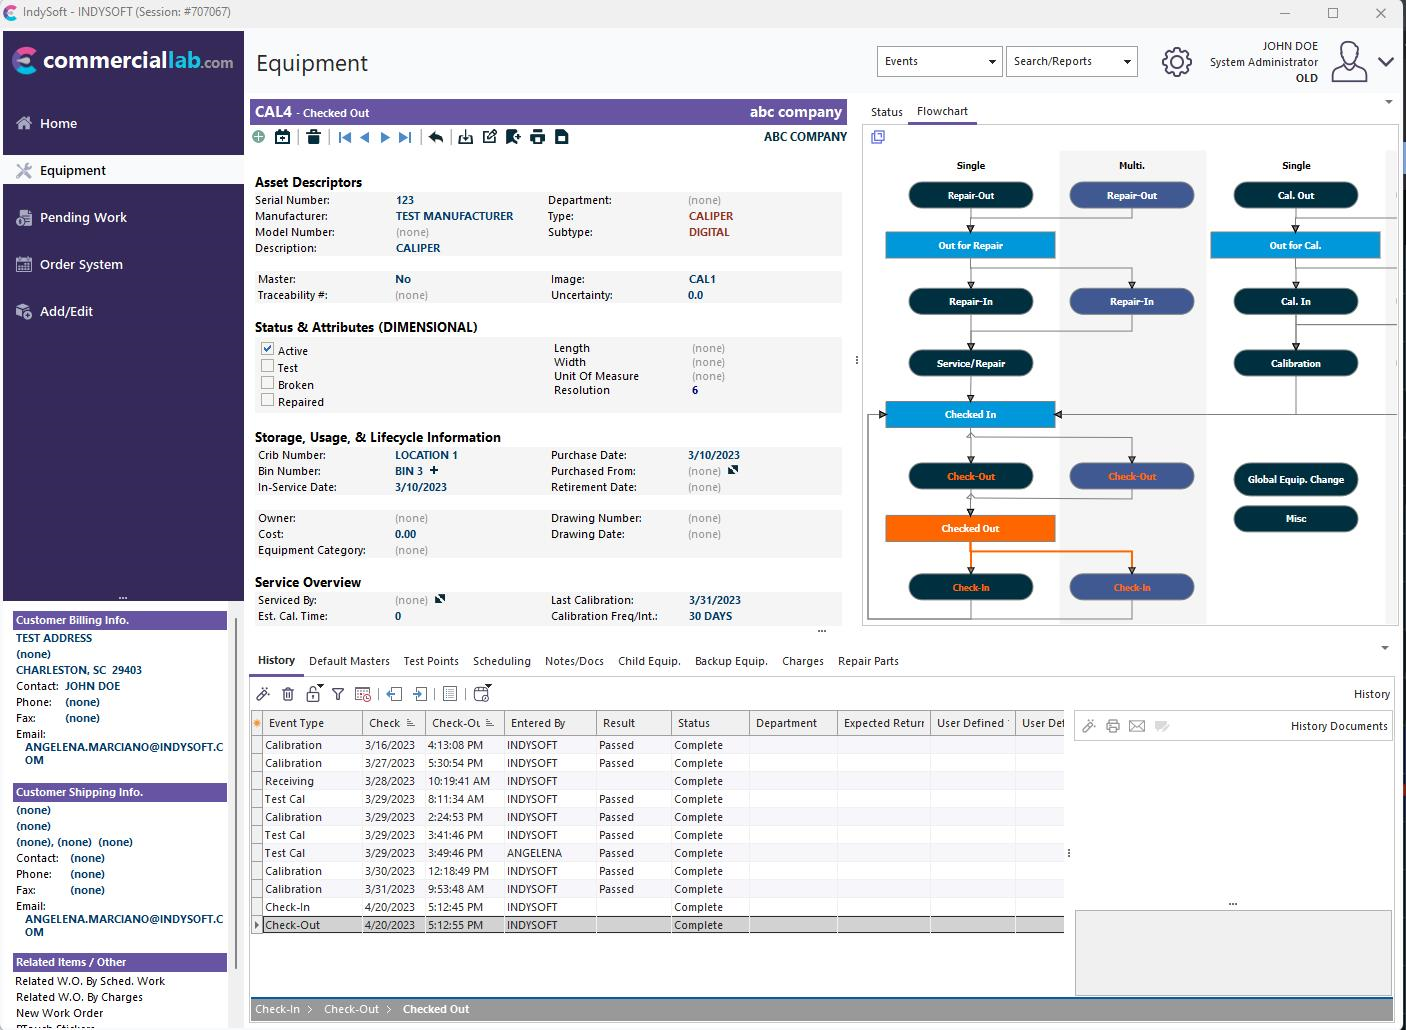
Flowcharts can also be displayed on the Equipment View tab. In version 13, new field layouts, the flowchart tab is always shown with the equipment view tabs. There are two additional options if you are using old equipment layouts - either the flowchart can be embedded within the Equipment Layout or displayed in the right-side panel, just beneath the 'Detail' dialog options:
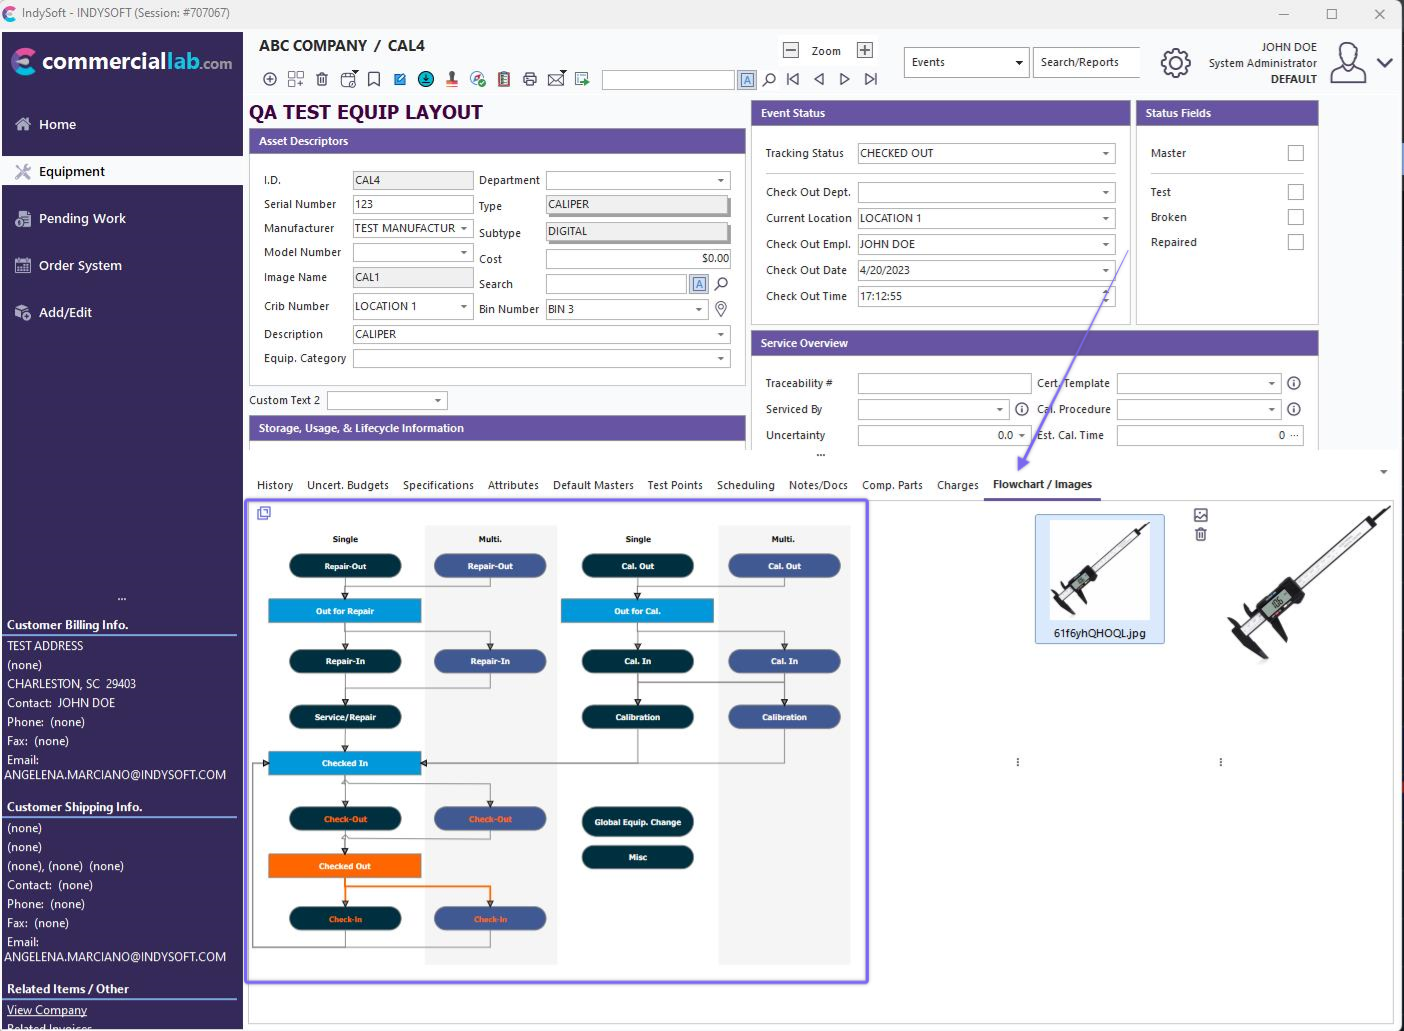
Flowchart in Equipment View Tabs
Example - Flowchart Embedded into Equipment Layout
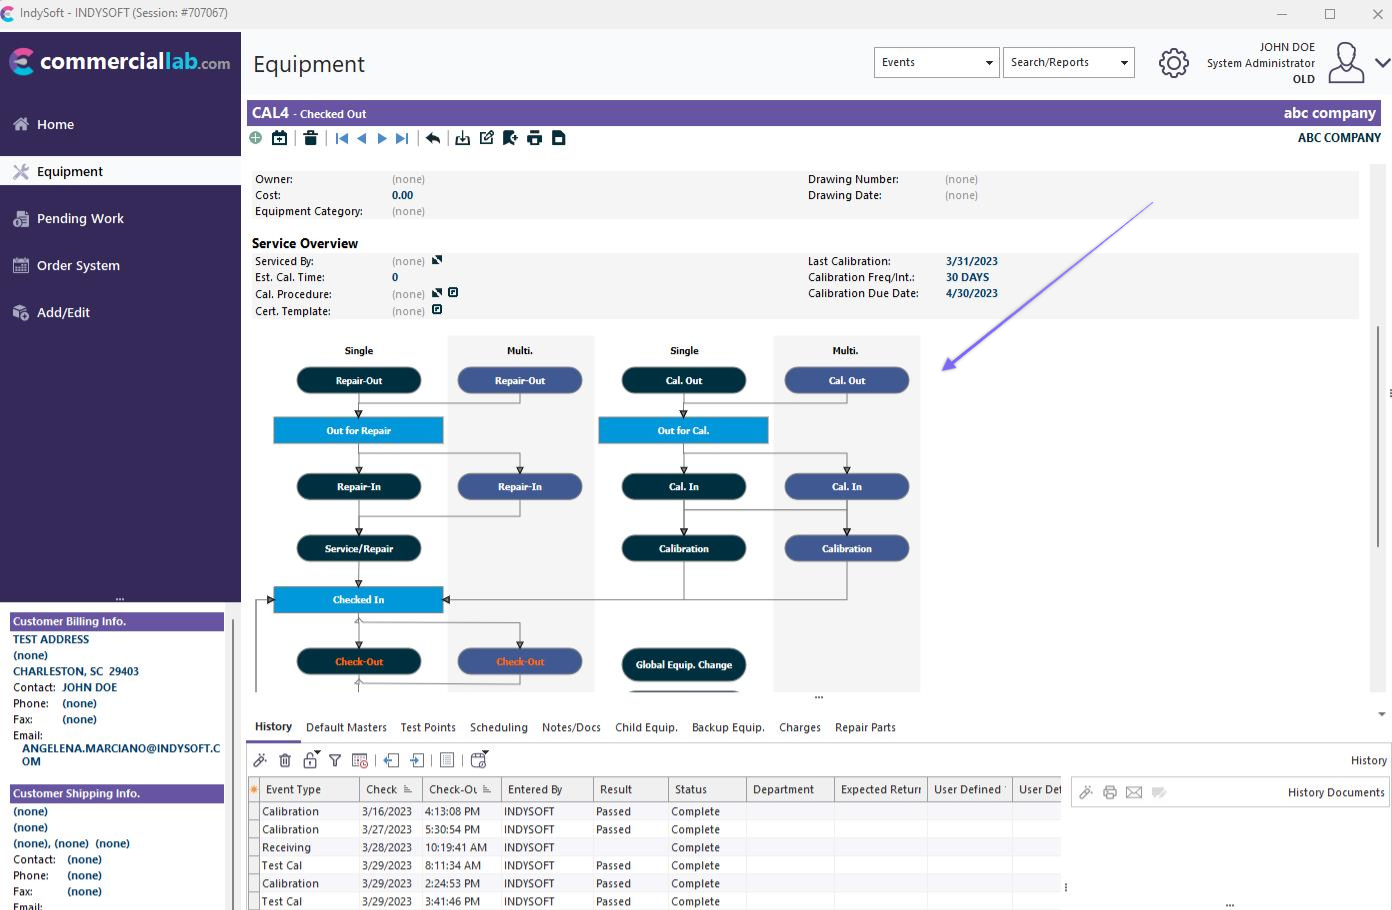
Equipment View Flowchart on Right-Side Panel
When a flowchart is shown in the right-side panel, an optional zoom percentage can be set up for each flowchart (in the Flowchart Editor). The flowchart display will default to this zoom percentage - users can use a single right-mouse click to toggle this zoom on/off quickly.
Flowcharts used with Equipment Layouts automatically highlight the object corresponding to the current tracking status for the asset. In the example below, the current tracking status is 'Awaiting Cal' - noted by the bright blue background color and white font. This highlight color and text font color/style can be modified in the Flowchart Editor. Next, any arrows extending from this current status object are automatically highlighted in the same color to note the appropriate 'next step(s)' in the process. In the example below, you will see a highlighted error pointing to 'In-House Cal.'. Finally, the steps previously performed in this 'round trip' are noted with a font color matching the color used to highlight the current status. So in the example below, you will note that two objects that are higher/earlier in the workflow have blue for the text color - 'Receive' and 'Routing.' This reminds the user that the 'Receive' and 'Routing' events have already been performed in the current round-trip. So, in summary, teach your users to 'follow the orange' (or other highlight color) to quickly see where an asset has come from, where it is, and where it should go.
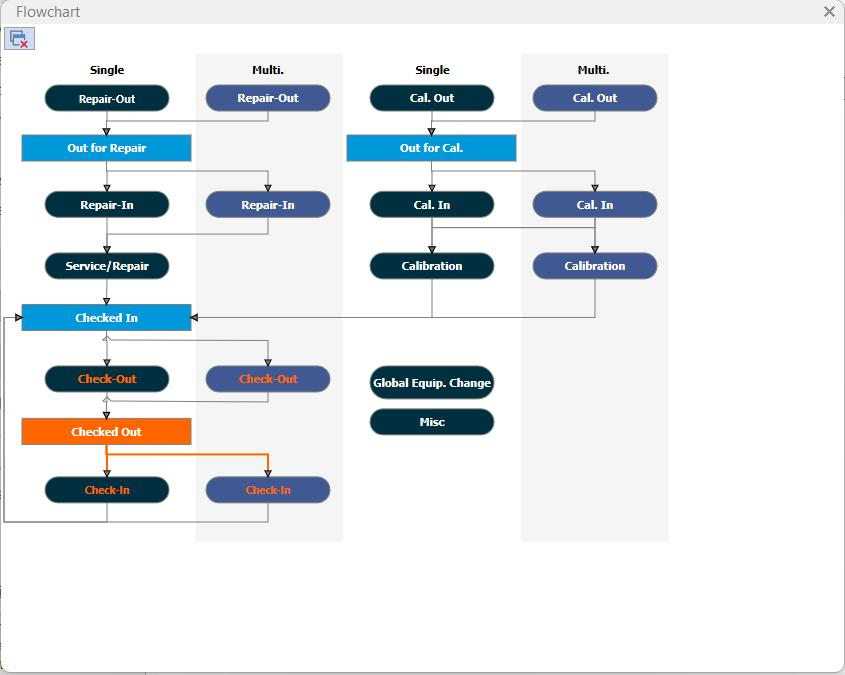
Example Equipment Layout Flowchart
Equipment Layout flowcharts are also interactive - just like Home View flowcharts. With Equipment Layout flowcharts, users click on the objects that are event-related. (Remember that in Home Layouts, the opposite is true - users click on tracking status-related objects). Clicking on an event object in an Equipment Layout flowchart will launch a new event. Note that it is possible to launch an event that is not highlighted in the flowchart. The blocking of events based on the equipment status or other filters should be set up through Workflow Configuration - Selection Rules. Think of the flowchart as a quick way to suggest the next appropriate choice(s) to the user - but not required.
There is an optional setting per flowchart for 'Show Event Trail From.' When enabled, the most recent 'round trip' events are also shown in the History tab/dialog in a 'breadcrumb' format. See the example below:
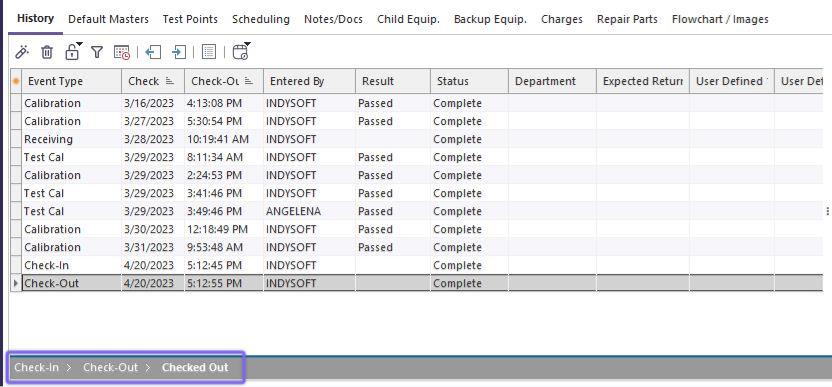
Example - Event Trail - Placement on Equipment View
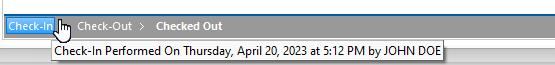
Example - Event Trail
This event trail is a duplication of the trail also highlighted in the flowchart (the objects with blue text) - but shown in a more linear format. If you move the mouse over an item in the Event Trail, it will highlight blue and, after a couple of seconds, will show a help hint that reminds you of the date/time for the event and the user that performed the event. Click on the event from the Event Trail to launch the event for review. This is equivalent to calling the History Detail dialog...selecting the historical event, and editing. |